
A Combined Chandra and LAMOST Study of Stellar Activity
Many proxies have been used to study the activity of different stellar components, such as X-ray emission from the corona and the Ca II H&K and Hα lines from the chromosphere. The study of stellar activity is very helpful for understanding the structures of stellar atmosphere, the magnetic dynamo, and the evolution of magnetic field. Lin He, et al. used the LAMOST DR4 stellar parameter catalog and Chandra point source catalog to study the stellar X-ray activity. They interpreted this bimodality as evidence of two sub-populations with different coronal temperatures, which are caused by different coronal heating rates. They found no trend of RX with stellar age for stars older than ~4 Gyr and there is a trough in the RX versus age distribution, with the lowest range of RX appearing at ages around 2 Gyr. The RX and RHα (proxy of chromospheric activity) are well correlated, as found in many earlier studies. Finally, they selected a sample of 12 stars with X-ray flares and studied the light-curve morphology of the flares.
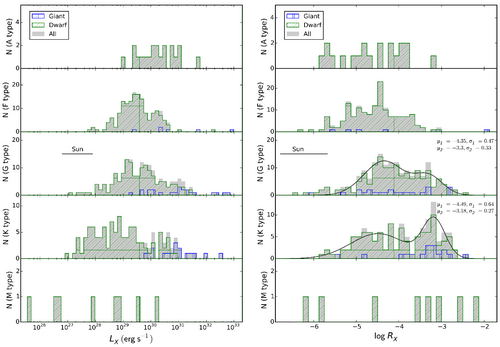
Figure. Left panel: histograms showing the distributions of LX for stars from A to M type. These histograms plotted with blue vertical lines, green slashes, and shaded area indicate giants, dwarfs, and all stars. The range of solar X-ray luminosity is 10 10 26.8 27.9 – erg s?1 (Judge et al. 2003), covering a typical solar cycle. Right panel: histograms showing the distributions of RX for stars of spectral type A through M. These histograms plotted with blue vertical lines, green slashes, and shaded area indicates giants, dwarfs, and all stars. The log RX of the Sun varies from -6.8 to -5.7 in a typical solar cycle.